Common Errors with Percents:
→"Since the industrial revolution, population has increased from 1
billion to 6 billion" described as "an increase of ____%"
Ex: Worldwide CO2 over ~several (sine-line but increasing)
vs. over ~1000 yrs ("e^t?") vs over ~100k yrs
vs 400k or 800k yrs.
Ex:World Population: Level Vs % Growth Vs. Annual Change
Above two also Re: f(t) vs f'(t) vs f''(t)
Effects of Quantities being compared
Ex: Drive M miles per year, use G gallons per year. Gas costs C $/gal,
car gets E mpg. HW exercises in which values are given for two of
these; third is indep, fourth is dep variable. Which are lines? Which
are nonlinear? Why? Interpretation?
Qualitative descriptions of graphs
Acidic concentration increased by 30% since industrial
revolution. Effect on pH =___?
(Ans: about 0.11)
Backwards: by 2100 pH could be 0.3 to 0.5 lower than today. Assume
0.37 lower than today, which is ___lower than pre-industrial. What
perc. increase in acidity, preindustrial to 2100, would this rep?
≈300% of the old conc (200% increase)
Rates
♦ Value vs. rate
Proportions (More Advanced, with modeling)
Exercise: Assuming the US consumes roughly 25% of the
world's resources (oil, etc) and using populations of 300M and 1330M
for US and China respectively, find a way to confirm the "would
double" above (phrased in more detail for students)
Slopes of lines; "slopes" of nonlinear functions
Looking at CO2: Graphs with different scales
Using recent data for last ~60 yrs
Contrast with example from a calculus book:
"Fancier tool" got a "tiny" difference. What lessons
do students learn? Worse, non-linearity of C(t) is at the very
heart of env. issue.
Key Concept: Areas under graphs of functions.
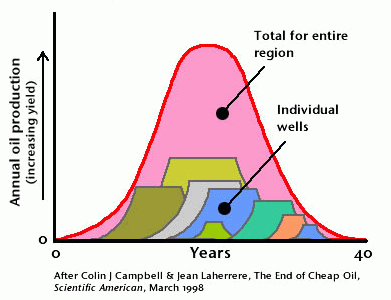
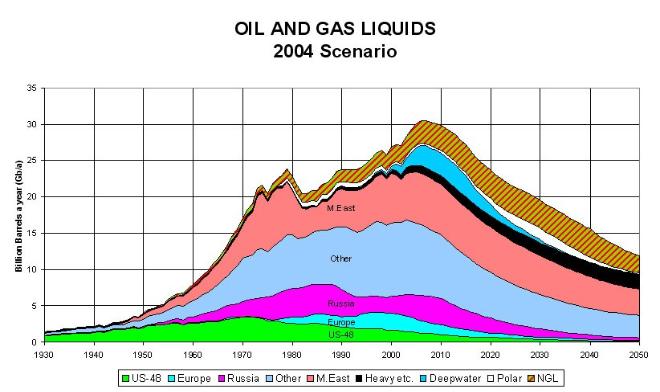
Some Key examples: Driving a car ; CO2 emissions; Peak oil
"65% of energy is wasted in the cooling system..if we have locally
done energy it's 15%..so if we could wave a magic wand and all
[UK]energy was coming from local sources you'd reduce your fossil-fuel
consumption by 50 per cent"
Graphical literacy
E.g. "decreasing, concave up" or, "increasing at a decreasing rate"
Log functions: the pH scale.
Ocean Acidification from CO2 emissions.
♦ Computing Average rates of change;
• Instantaneous vs average rates of change;
• How the two are related.
•Peak oil not same as "no more oil is left"
•Rather, maximum rate of extraction in e.g. bbl/yr
♦Units: Oil depletion of "3 mbd" in press refers to decrease
rate of (3million barrels/day) / year
Example: HW reading and exercises based on What's Your
Consumption Factor? by Pulitzer-Prize winning writer Jared
Diamon, writing in NY Times:
"Per capita consumption rates in China are still about
11 times below ours, but let's suppose they rise to [US's
consumption] level. Let's also make things easy by imagining that
nothing else happens to increase world consumption -- that is, no
other country increases its consumption, all national populations
(including China's) remain unchanged and immigration ceases. China's
catching up alone would double world consumption rates."[emph
added]

Looking at CO2: Graphs versus numerical data

Linear model for CO2 as a function of the year:
A. By connecting the first and last of the given points:
C(t) = 1.5545t - 2739.21
B. Using Linear Regression on Calculator:
C(t) = 1.55192t - 2734.55
Peak oil not same as "no more oil is left" ; rather,
maximum rate of extraction in barrels per year. (units -- Oil
depletion of "3 mbd" in articles refers to decrease of (3million
barrels per day)/year

Important case: Area under the graph of f(t), t=time.
