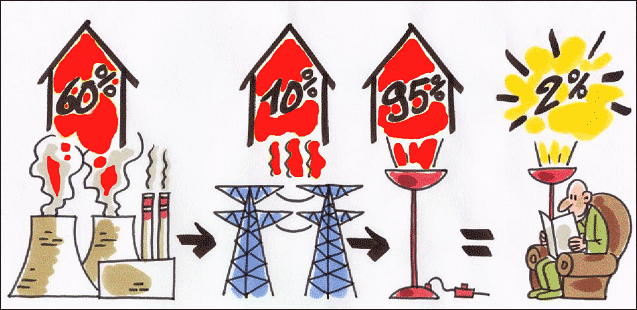

The graphic contains four "steps" which we may view left-to-right. In the first (left-most) graphic, there is a conventional coal or nuclear power plant, in which 60% of the input energy is lost as "waste heat". That leaves 40% of the input energy left, to be passed on to step 2 (the electric transmission grid).
The second figure represents the transmission of the energy (received from step 1) over the grid. It gives a figure of 10% which on average (depending on type of transmission lines and the distance over which the electricity is transmitted) is how much of that energy it receives, is lost as waste heat by the time the electricity reaches the customer's home. Thus 90% of the energy that was received from the power plant reaches the home. But this is 90% of 40% of the input energy, so the proportion of the original input energy (coal or nuclear) in the conventional power plant that is received at the customer's home electrically is (.4)·(0.9) = 36% (So far, already 64% of input energy has been lost/wasted!)
In similar fashion, the proportion of the original input energy in the conventional power plant that is not lost as waste heat in any of the steps -- given that only 5% of the energy that goes into the halogen torchiere is turned into light and the other 95% is lost as waste heat -- is (.4)·(0.9)·(0.05) which is equal to 0.018 or 1.8%, which the brochure rounds to 2%. For every 100 units of energy in the power plant that makes its way into either waste heat or to lighting the book the man is reading in the last graphic, 98 units are lost as waste heat in one of the steps, and 2 units are actually converted into light, hence the 2% figure in the graphic.